Using Charts |
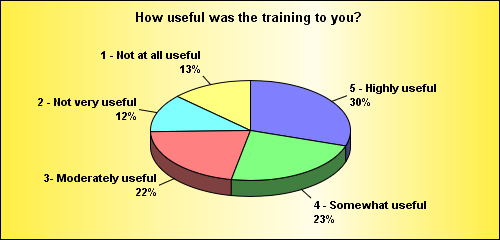
Univariate and Cross tabulation reports can now include charts. To produce
the charts, simply click the "graph" option on that page.
When the report is viewed, it will include a graph. For example:

|
The chart can be edited and downloaded to the browser, Excel and PowerPoint. Clicking on the graph produces a page with the following options.
The top of the page includes four links:
Below the graph, four links open up sections that allow changing the graph appearance:
At the bottom of the page, three buttons determine what to do next:
System Administrator note: About fonts in charts
The fonts that are available depend on the fonts that are installed
in the system, in the application server's Java VM.
When using international character sets such as Chinese, an appropriate font
must be installed. Some fonts to consider are:
Microsoft Arial Unicode MS and Cyberbit.
Default chart options can be set by
adding the following to viewsflash.properties:
chart.fontstyle=Arial Unicode MS
chart.fontsize=10
chart.fontcolor=0
chart.colors=8080FF,80FF80,FF8080,80FFFF,FFFF80,FF80FF
chart.bgcolor=0x00FFEE44
chart.3d=true