Univariate Analysis |
Univariate Analysis provides a convenient way to produce the most useful statistics about some or all saved questions.
For numeric fields, which contain only numeric values or missing data, ViewsFlash can calculate measures such as mean, standard deviation, median, mode, high and low. Simple frequency distributions are available as well.
When data is stored in more than one format, a Data menu appears at the top
of these pages:
Data:
Change the choice to analyze data from different storage formats. See Save page
for how to change where the data is stored.
Otherwise, a simple message acts as a reminder of where the data resides:
Data: from database table
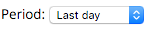
The Period menu allows selecting which records will be included in the report: All records, or just the records in the most recent hour, day, etc.
Note that scheduling a report by email will change the period to a matching value, but you can override that by setting this menu again.
The Filter menu appears next, which allows limiting the records that will be
retrieved. For example, selecting a comment field and choosing must be "answered"
will display all comments submitted.
Filter:
must be
this value:
The new filter option Custom also allows using your own WHERE clause.
Select questions to display. Check the names of all the questions you want to tabulate. To view the full text of the questions, check the Show Question Text box.
Questions created with the ReportText style are displayed in this list. These questions can only be edited using the List Editor, as they are invisible in the Visual editor and in respondent questionnaires. The matrix header questions in Likert and Semantic Differential Scales, when opened, include a field:
Use as report text
This field needs to be checked for the question to be visible in this list. By selecting it, the explanatory text that normally appears above the matrix is shown in the report.
To see other questions that are not listed, check the Show all questions box; questions not shown are usually unsuitable for analysis, such as text fields not selected for tallying in the Options / Tally page.
Select the options in the "For each question, show" section as needed. The graph option enables charts.
The View report in Excel option will retrieve the data and display it in Excel.
The header and footer regions allow defining report headers and footers. HTML can be used in these fields.
After pressing Submit, click on the View Univariate report link under the Submit button. The report will display in a pop-up window or in Excel.
From the pop-up results window, use the browser's File Print or File Save As commands to print or save the report.
The Edit/Select All and Edit/Copy commands can be used in the results window to paste the resulting tables into programs such as Word and Excel.
Saving and emailing the report
The report can be saved permanently for later use by giving it a name and
pressing Create:
![]()
When you do so, the report setup now includes options for sending the report by e-mail at the bottom of the page, above the Submit button:
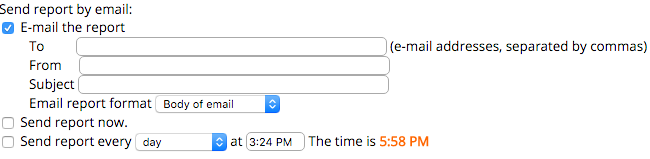
When you click on the E-mail the report checkbox, other options appear that let you enter a list of e-mail addresses in the To field, a From e-mail address, and an email Subject. A dropdown menu lets you choose between sending the report embedded in the body of the email or as an HTML attachment. The "Send report now" checkbox sends an email immediately. The "Send report every" checkbox allows scheduling a report to be sent periodically as specified by the dropdown menu. NOTE that changing this dropdown will change the value of the report Period at the top of the page to a matching value. For example, if you pick a weekly report, the period will be changed to a week as well, but you might want a cummulative report of all the data. Just change tha value of the Period, at the top of the page, after specifiying how often you want the report to be sent. When a report does not include all data, an extra line appears in the emailed report showing the period chosen.
To access the report later, click on the Reports link and then on the report name.
The look and feel of the Univariate Analysis report can be modified by creating a custom Univariate Style template based on the UnivariateReport style. In this case, an additional drop-down menu will appear that will allow selecting that style.