Data retrieval query |
Data Retrieval retrieves the content of completed questionnaire forms to the browser and to Excel.
A Data menu at the top
of the page specifies what data should be displayed in the report:
Data:
Choosing "Responses in progress" allows reviewing responses that have not been submitted and saved yet. Responses are not saved until they are submitted. After they are submitted, they can be retrieved using one of the other options, depending on how responses are saved. See Save for how to change how the data is stored.
Otherwise, a simple message acts as a reminder of where the data resides:
Data: from database table
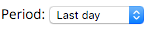
The Period menu allows selecting which records will be included in the report: All records, or just the records in the most recent hour, day, etc.
Note that scheduling a report by email will change the period to a matching value, but you can override that by setting this menu again.
The Filter menu allows limiting the records that will be
retrieved. For example, selecting a comment field and choosing must be "answered"
will display all comments submitted.
Filter:
must be
this value:
"Select questions to display" lists the names of all questions saved. Clicking the All check box allows selecting and de-selecting all questions. Clicking the Show question text check box displays the complete text of each question.
For each question, choose whether to display just the question name at the
top of the report or the question text, or both.
Also choose whether to display each answer's text rather than its value.
The first two check boxes indicate what to display at the top of the report: the name of each question, and the full text of the question.
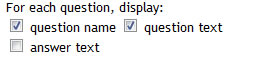
The answer text checkbox indicates that, rather than showing the values stored in the database for each response, the text that corresponds to that response should be used in the report. For example, if a radio button has values 1,2 and 3 for Low, Medium, and High, checking this box will show the words Low, Medium or High instead of the values 1, 2 or 3.
The Report Format drop down allows three formats: Table, CSV, and XML. The CSV format displays the data in comma delimited format. The XML format displays the data in that format.
View in Excel can be used with the Table format display; the View Report link will show the data in Excel.
The header and footer regions allow defining report headers and footers. HTML can be used in these fields.
After pressing Submit, click on the View data report link to display the report in a pop-up window.
Saving and emailing the report
The report can be saved permanently for later use by giving it a name and
pressing Create:
![]()
When you do so, the report setup now includes options for sending the report by e-mail at the bottom of the page, above the Submit button:
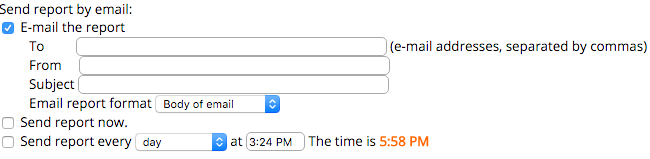
When you click on the E-mail the report checkbox, other options appear that let you enter a list of e-mail addresses in the To field, a From e-mail address, and an email Subject. A dropdown menu lets you choose between sending the report embedded in the body of the email, as an HTML attachment, or as a CSV attachment that can be opened in a spreadsheet. The "Send report now" checkbox sends an email immediately. The "Send report every" checkbox allows scheduling a report to be sent periodically as specified by the dropdown menu. NOTE that changing this dropdown will change the value of the report Period at the top of the page to a matching value. For example, if you pick a weekly report, the period will be changed to a week as well, but you might want a cummulative report of all the data. Just change tha value of the Period, at the top of the page, after specifiying how often you want the report to be sent. When a report does not include all data, an extra line appears in the emailed report showing the period chosen.
To access the report later, click on the Reports link and then on the report name.
Customizing the report
The look and feel of the Data retrieval report can be modified by creating a custom Data Style template based on the DataReport style. In this case, an additional drop-down menu will appear that will allow selecting that style.
Using the Table format report
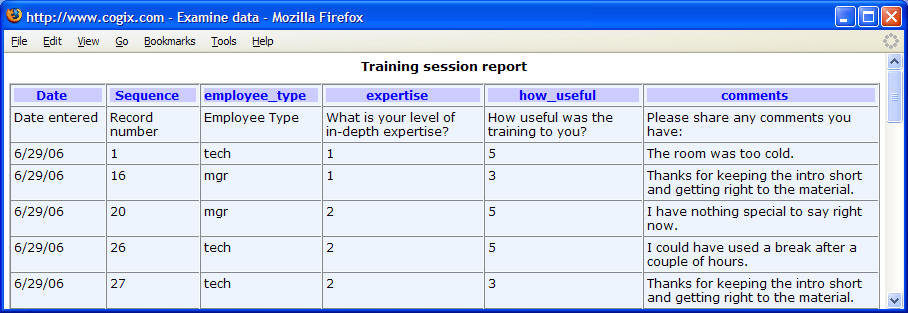
When View in Excel is not selected, the data is displayed in the browser in
tabular form. If the question name has been selected, the report can be sorted
on any column by clicking on the labels in the top row:
Modifying records
These features are useful for identifying outliers or malicious entries and
flagging them accordingly. A Filter can then be used to remove flagged records
from analysis.
When the questionnaire saves data in its own table ( see Options / Save ), and the report uses the Table format, the Allow modifying selected records option is available.
When checked, it offers the following options:
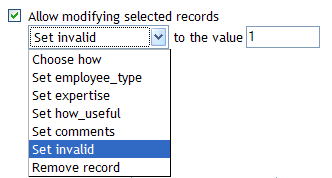
The report will include an extra column, "Select", and Submit and Close buttons:
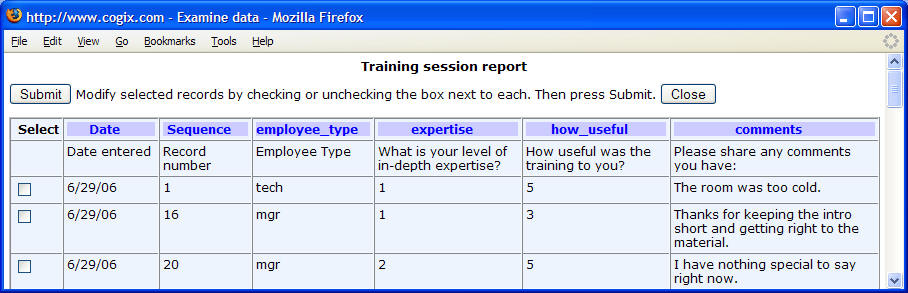
The checkbox in the Select column will be checked if the value of the "invalid" field is set to 1, and will not be checked otherwise. To change a record's invalid setting, check or uncheck the box and press Submit.
The "Remove record" option will delete selected records from the database altogether when Submit is pressed. It is not possible to restore them later.
Troubleshooting filters
After selecting a filter, press the Submit button at the bottom of the page. After the page is submitted, the "Show filter SQL" link, which is displayed below the Filter menu, will display the portion of the SQL WHERE clause that will be used to enforce the filter. This can be useful when a filter is not producing the desired result.
If a data analysis report produces unreasonable results, it's a good idea to retrieve the actual data using the filter and without using a filter.